In statistics, quartiles are a way to divide a dataset into four equal parts. They help us understand the spread and distribution of values. The first quartile (Q1) marks the boundary below which 25% of the data falls, while the third quartile (Q3) marks the boundary below which 75% of the data falls. The second quartile (Q2) is the median, splitting the data into two equal halves.
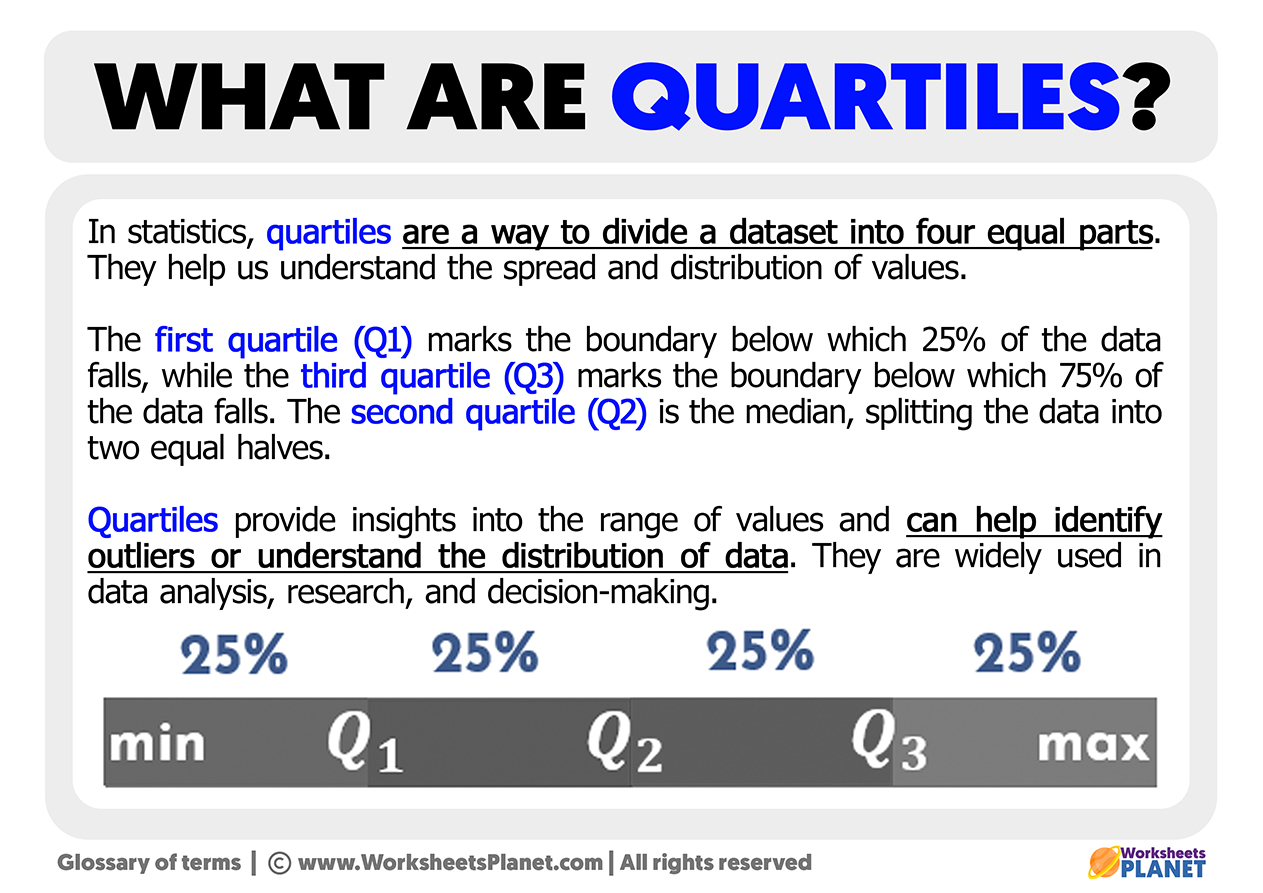
Quartiles provide insights into the range of values and can help identify outliers or understand the distribution of data. They are widely used in data analysis, research, and decision-making.
